| Cause and Effect Analysis Identifying the Likely Causes of Problems (Also known as Cause and Effect Diagrams, Fishbone Diagrams, Ishikawa Diagrams, Herringbone Diagrams, and Fishikawa Diagrams.) | ||||
| ||||
| We'll look at Cause and Effect Analysis in this article. About the Tool Cause and Effect Analysis was devised by professor Kaoru Ishikawa, a pioneer of quality management, in the 1960s. The technique was then published in his 1990 book, "Introduction to Quality Control." The diagrams that you create with Cause and Effect Analysis are known as Ishikawa Diagrams or Fishbone Diagrams (because a completed diagram can look like the skeleton of a fish). Cause and Effect Analysis was originally developed as a quality control tool, but you can use the technique just as well in other ways. For instance, you can use it to:
Follow these steps to solve a problem with Cause and Effect Analysis: Step 1: Identify the Problem First, write down the exact problem you face. Where appropriate, identify who is involved, what the problem is, and when and where it occurs. Then, write the problem in a box on the left-hand side of a large sheet of paper, and draw a line across the paper horizontally from the box. This arrangement, looking like the head and backbone of a fish, gives you space to develop ideas. Example: In this simple example, a manager is having problems with an uncooperative branch office. Figure 1 - Cause and Effect Analysis Example Step 1 (Click image to view full size.) 
Step 2: Work Out the Major Factors Involved Next, identify the factors that may be part of the problem. These may be systems, equipment, materials, external forces, people involved with the problem, and so on. Try to draw out as many of these as possible. As a starting point, you can use models such as the McKinsey 7S Framework (which offers you Strategy, Structure, Systems, Shared values, Skills, Style and Staff as factors that you can consider) or the 4Ps of Marketing(which offers Product, Place, Price, and Promotion as possible factors). Brainstorm any other factors that may affect the situation. Then draw a line off the "spine" of the diagram for each factor, and label each line. Example: The manager identifies the following factors, and adds these to his diagram:
(Click image to view full size.) 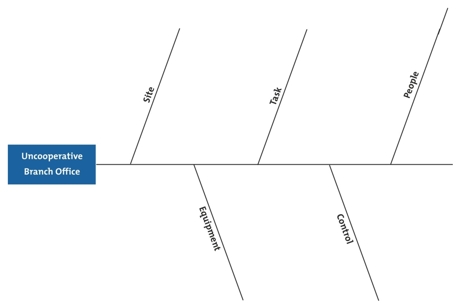 Step 3: Identify Possible Causes Now, for each of the factors you considered in step 2, brainstorm possible causes of the problem that may be related to the factor. Show these possible causes as shorter lines coming off the "bones" of the diagram. Where a cause is large or complex, then it may be best to break it down into sub-causes. Show these as lines coming off each cause line. Example: For each of the factors he identified in step 2, the manager brainstorms possible causes of the problem, and adds these to his diagram, as shown in figure 3. Figure 3 - Cause and Effect Analysis Example Step 3 (Click image to view full size.) 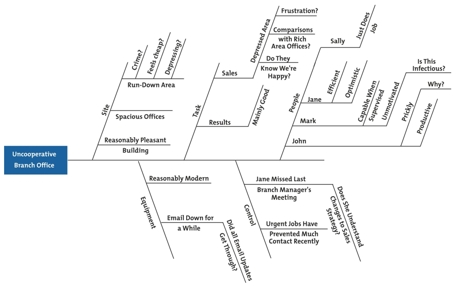 Step 4: Analyze Your Diagram By this stage you should have a diagram showing all of the possible causes of the problem that you can think of. Depending on the complexity and importance of the problem, you can now investigate the most likely causes further. This may involve setting up investigations, carrying out surveys, and so on. These will be designed to test which of these possible causes is actually contributing to the problem. Example: The manager has now finished his Cause and Effect Analysis. If he hadn't looked at the problem this way, he might have dealt with it by assuming that people in the branch office were "being difficult." Instead, he thinks that the best approach is to arrange a meeting with the Branch Manager. This would allow him to brief the manager fully on the new strategy, and talk through any problems that she may be experiencing.
Key Points Professor Kaoru Ishikawa created Cause & Effect Analysis in the 1960s. The technique uses a diagram-based approach for thinking through all of the possible causes of a problem. This helps you to carry out a thorough analysis of the situation. There are four steps to using Cause and Effect Analysis.
Original: MindTools |